This is an analysis of the effect of age, income and area on the Brexit referendum. The statistics used are compiled from the NOMIS website that compiles ONS data. The age band data used is taken from the end of 2015, and the mean income from the end of 2016. The areas are the pre-2015 NUTS2 areas. I have used a linear regression analysis, however some results would be best scrutinised under a K-analysis as they reflect a rejection of the null-hypothesis, do not have a strong linear correlation, do not appear to fit a polynomial trend-line, and appear to cluster strongly.
I begin with the hypothesis that the outcome of the Brexit vote can be determined in part by local and national attitudes towards the outcome. I also believe that the effect of these two factors is dependent on the age bracket of the electorate, as well as their income as a proxy for qualification-level. I begin by deconstructing the areas of interest by their propensity to vote, and propensity to vote remain. I then look at the distinguishing features of these constituencies and try to explain disparity in turnout and result based on local and national factors, as well as age and income.
I came to the conclusion that there was a multiplier effect on the result and turnout from the age-demographics of the area, as well as local attitudes. From using the proportion of the electorate that is over-65 by area, assuming a constant proportion of them are registered to vote across all areas, one can extrapolate the effects of local and national trends on their propensity to vote and propensity to vote remain. The observed effects, I think, are greater for younger age-bands, but this requires a follow up analysis that requires more data.
The result as a whole
Beginning with the result in total, the graph below shows the proportion of the electorate that voted, against the proportion of the ballots cast in favour of remain. This is an interesting graph as it shows the disparity between remain and leave areas in terms of their propensity to vote.
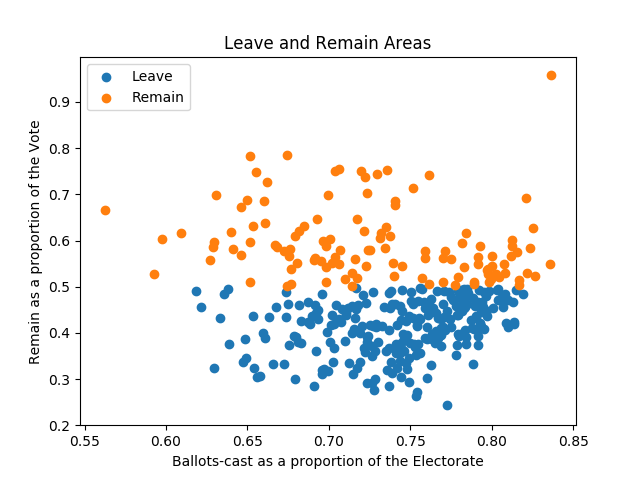
The remain areas are far more diffuse in terms of propensity to vote, and the leave areas are far more concentrated in terms of turnout and how marginal the result was. This indicates that the election was mainly swung by marginal constituencies with high turnout rates. Additionally, the majority of these areas were in the south or midlands.
Of the 35 leave constituencies with a greater than national-average turnout (72%), only 15 were in the north, and a further five were in wales. None of these areas were in Scotland or London, and most interestingly (since it is the area generally seen as the deciding reason why Labour has not so far come out in favour of a second referendum), only three belong in the North East.
Of the 62 areas that voted heavily and also voted for remain, it is interesting to note that only seven areas were in London (33 areas in total), and eight in Scotland (32 areas in total).
Most of the areas inside of those sub-divisions of the UK voted for remain.
The rest of the 62 areas were dotted around the UK, in mostly brexit-driven areas as well as areas such as the Isles of Scilly.
Moreover, if we look at the low voting-density areas with a clearcut win in either direction, we discover some more about the other subdivisions of the UK.
Of the 74 leave areas with less than average turnout, nine were in the North East- a full 3/4 of its total number of areas. These nine had a mean remain vote of just under 40%. This implies one of three things:
(1) Voter engagement is historically low in the North-East,
(2) If we extrapolate the result to the segment of voters who didn’t vote, then there were significant numbers of leavers that were apathetic about the vote due to the high levels of Leave in the area,
(3) The remain vote did not show in these areas due to the national narrative in conjunction with the local mood towards leave.
Another explanation I shall not consider due to lack of information is the effect of First Past the Post mentality that led marginal voters not to vote in areas with a high concentration of similar viewpoints.
To either eliminate or illuminate numbers (2) and (3), we need to analyse similar areas in the rest of the country.
I hypothesise that similar areas will reflect conclusion (3).
Of the 57 remain areas with low turnout, 25 are in Scotland, and 21 are in London. Since there are only 32 and 33 areas in Scotland and London respectively, this represents a large majority of both strongly clustered remain areas.
This does give credence to numbers (2) and (3), since it implies that the high concentration of similarly minded voters contributes to the turnout likely-hood. This is interesting, as one can notice this from the first graph of voters against remain votes, as there are a high-density of border-leave areas.
To properly ascertain the segmenting of that graph into similar areas, a K-analysis should be done.
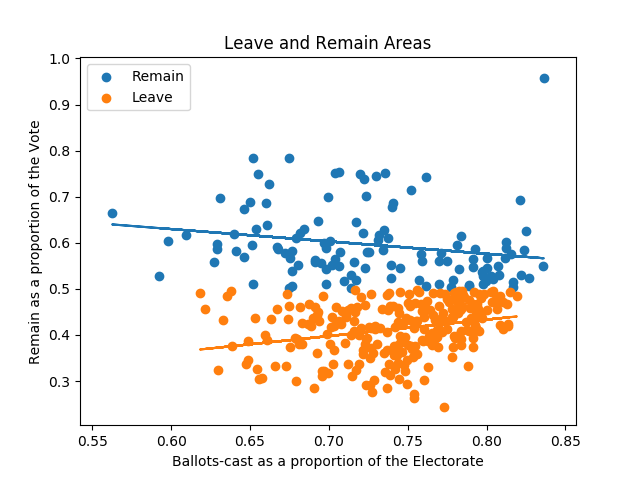
This is also obvious when we insert linear trend-lines into the first graph. The trend-lines both point towards the high voting propensity, 50/50 split.
So what is the geographical placement of these borderline areas? Of the 172 areas that attained over 75% turnout, only 8 were in London, Scotland or the North East. A further three were in Wales. This means that the rest were in central/southern England. So why did these areas in particular have a more divisive and well attended vote?
Income as a predictor?
As you can see from the graph below, the propensity to vote and vote remain in areas with a high turnout are not related by the mean income of the area.

However, it is interesting to note that mean income is also not a good predictor for turnout for this range. A widened analysis is necessary to determine if this holds true for all ranges, which would be interesting in its own right.
Age before Beauty
Next we look at the proportion of the electorate that is over 65 in these areas.
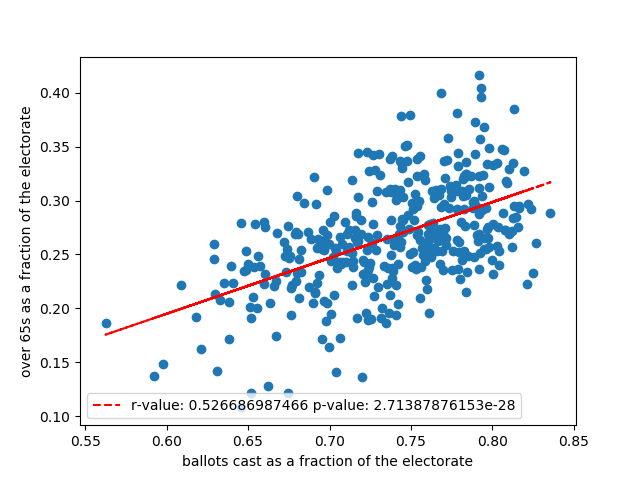
We see an interesting trend-line for both leave and remain areas, though with a small correlation implying clustering rather than a direct relation.
However, extrapolating a linear relation shows the propensity to vote went up with an increase in over 65’s in Leave, while a decrease in remain areas.
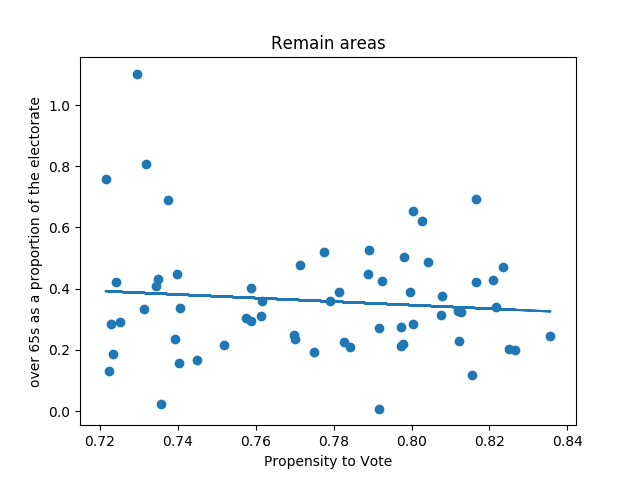
This relation is particularly weak, however it could show that there is a certain shyness associated with these voters, as determined by the gradient in either.
This implies, if we assume the national trend of over 65’s voting in favour of brexit overwhelmingly, that there is some effect on the elderly turnout because of local attitudes.
I hypothesise that this is also a measurable feature of younger age brackets.
In fact, I think that the younger age groups are more effected by those around them than the elderly.
This in particular shows from the dispersal of propensity to vote and propensity to remain in remain areas mostly in Scotland and London that have very low percentages of over 65’s.
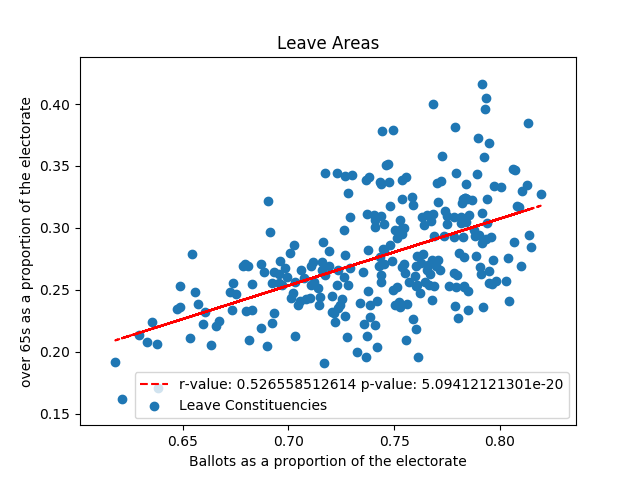
I believe that this backs up conclusion (3). Firstly, the elderly age bracket tends to follow the national trends for voter turnout, pushing up the ballots cast as a percentage of the electorate or leaving them unchanged for both remain and leave areas. This then implies that we can assume the national trend that older voters tended towards leave, backed up by the graphs below.
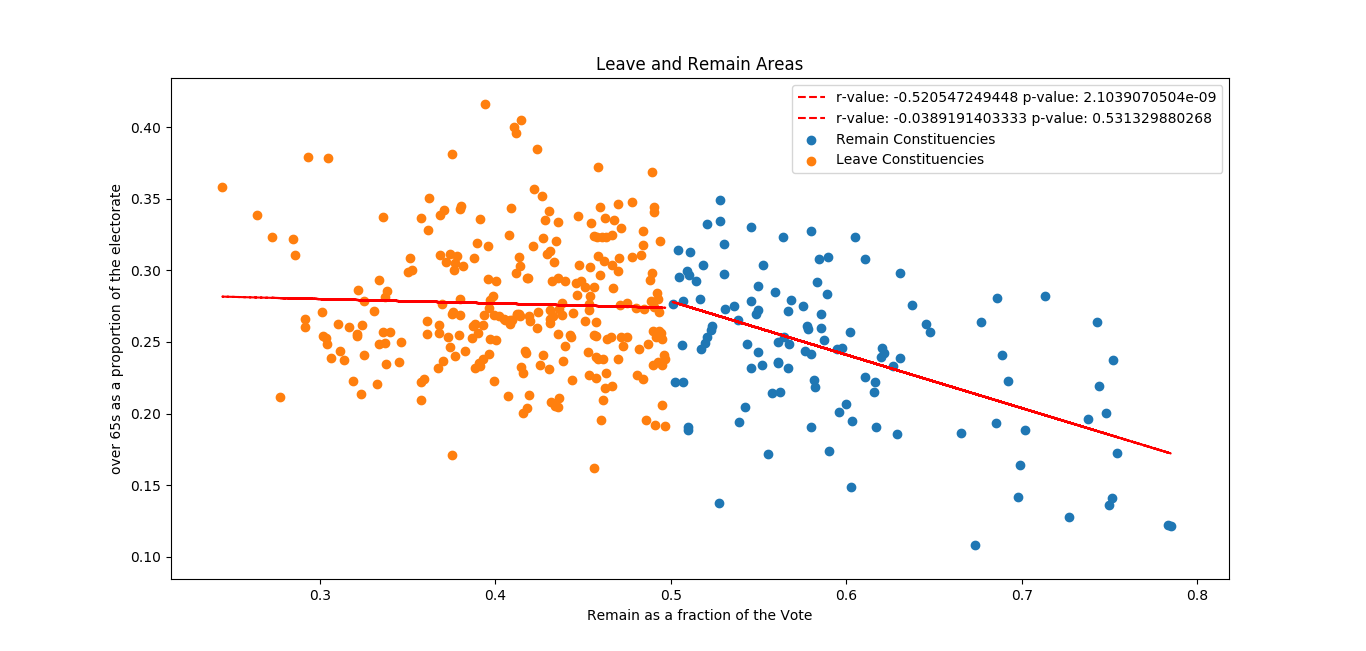
This graph does indeed back up this assertion, as it shows that elderly views in strongly leave areas were simply reflected by the rest of the population, and acted negatively on remain areas.
In which case, the slopes of the graphs for proportion of over 65’s (o65) against propensity to vote (PV) and propensity to remain (PR) to calculate their reaction to local views, which have a marginal but not unnoticed effect.
The stronger the graph of o65’s vs PV reflects the national trend, the more the local views reflected their own, and vice-versa.
This does go some way to explaining the geographic placement of the borderline areas. These areas were also, after all, ones with the highest percentage o65 population as part of the electorate.
Conclusion
The areas that had the smallest margin between remain and leave were also the ones that had the highest turnout. These areas were largely in the south and east of England, and can be explained by a high proportion of elderly voters for the most part, but also that their views were highly reflected by others in these areas.
The areas with a large concentration of similar view-points and fewer o65 in proportion to the electorate also suffered from general apathy. This apathy may be put down to a mentality of First Past the Post, in which on the fence voters are dissuaded because of the high-density of similar local views.
The national narrative being assumed to be largely in favour of leave, this implies that in the highly remain areas, people who felt on the border in favour of Remain were discouraged from voting by the belief that remain would win due to high exposure to other remainers compounded with the overwhelming trend in the news against the EU.
For low turnout areas of leave such as the North East, the result also implies that these same marginal-remain voters were also dissuaded by the local and national anti-EU consensus, though this could also be reluctant leavers deciding not to vote.
Follow Up
A comparison of targeted advertisement spending on an area-by-area basis in conjunction with the propensity to vote for each age band would then be interesting for its ability to measure the effects on turnout by age of national coverage, and subsequently by local views. Generally, assuming a constant turnout rate for over 65’s in all areas, I have found that local views effect this age range marginally or not at all. This is because the local views, reflected in clusters of leave or remain, seem to set a base for the overall views, as well as dissuading or persuading others. The national trends either amplify the strength of the argument, or dissuade marginally-disagreeing voters, again dependent on age range.
I shall also complete a follow up analysis of the PV and PR in comparison to the percentage qualified professionals in the workforce by area. This is to see if qualification-status, like age, is a good national predictor for these two factors, and what local/national effects there are on people in this group.
